We Make Reporting Easier for Your Whole Team
We help associations bring clarity to their data, so you can spend less time wrangling spreadsheets and more time making informed decisions.
Your data, organized and easy to understand.
Everything you need to make your data more useful and less stressful.

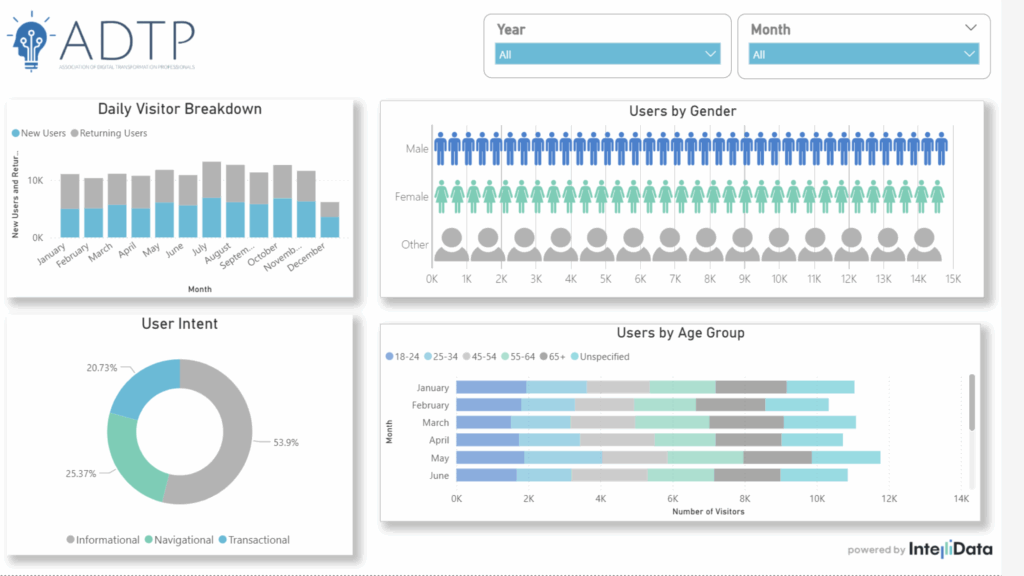
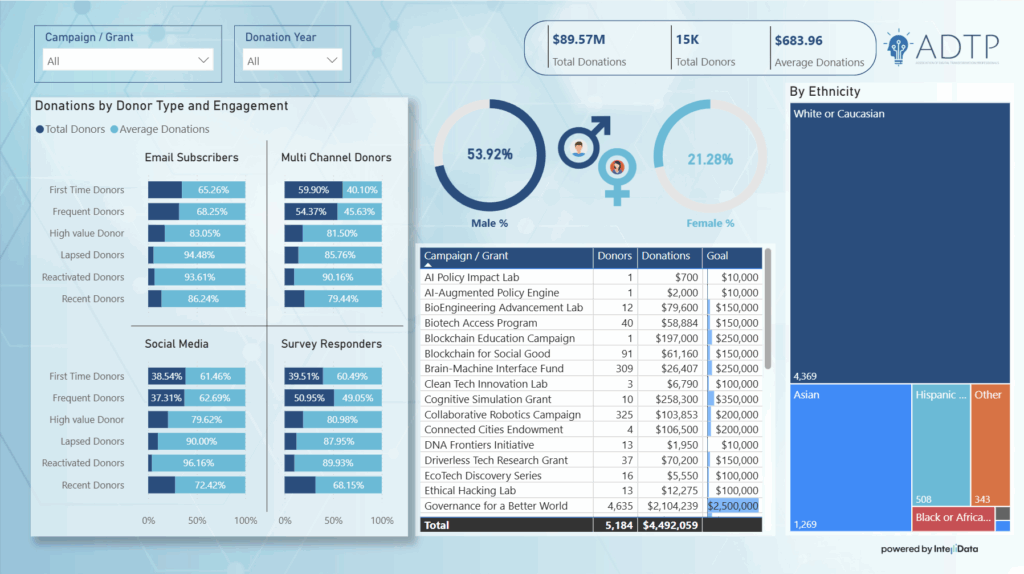
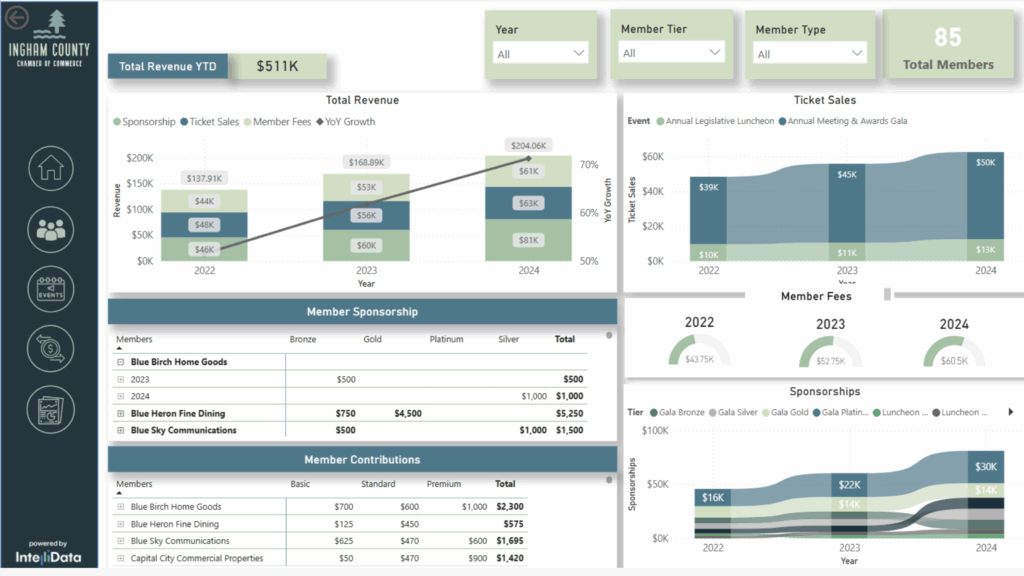
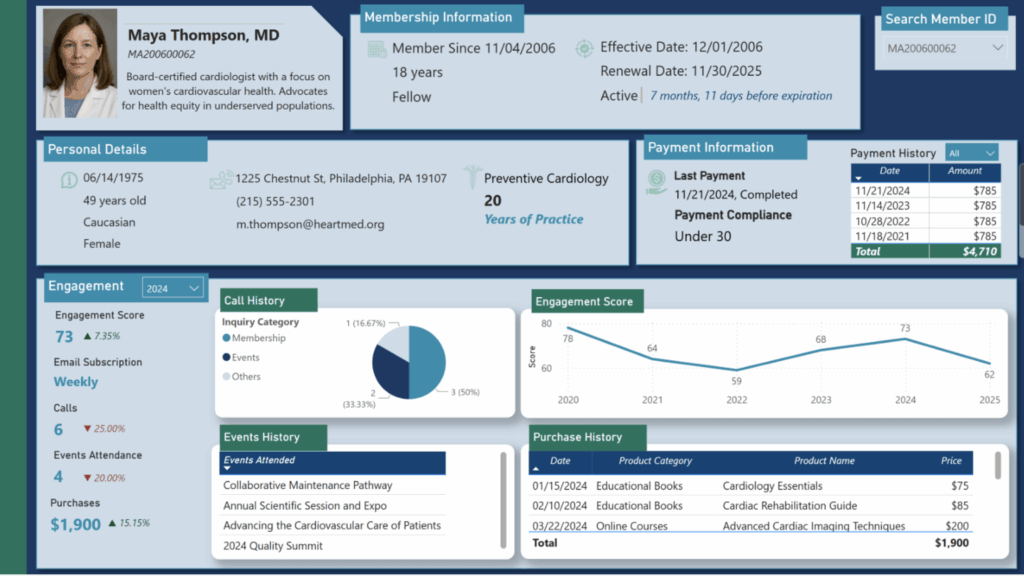
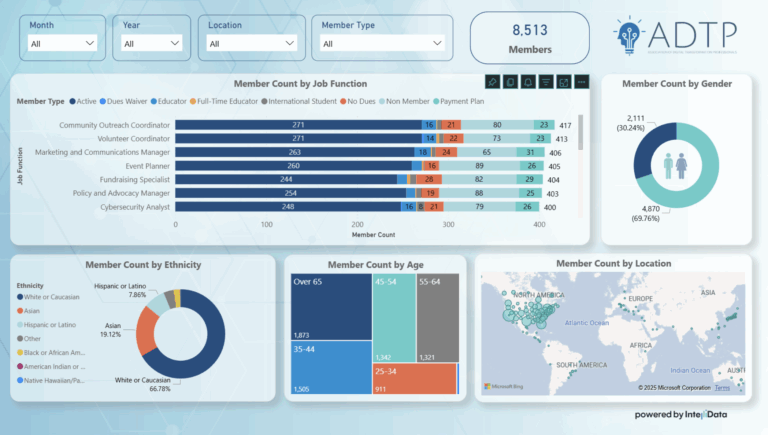
Built for What Your Association Tracks
From board KPIs to membership trends, we tailor your dashboards to the real metrics that matter in your world—not just generic charts.

Pulls From the Systems You
Already Use
We connect to your AMS, CMS, event tools, email platform, and more—so you can stop chasing down reports across five platforms.

Easy to Read, Easier to Use
No more overwhelming spreadsheets or confusing charts. Just clean, clear visuals that help your team and board stay on the same page.

Flexible and Supported
Need a tweak? A new report? We’re here when your data needs change or grow.
We play Nice with Your Tech Stack
If your team relies on it, we can probably pull data from it.
IntelliData dashboards pull from the systems you already use, so you’re not stuck manually exporting reports from different places. We can integrate with your:
- AMS or CRM
- CMS
- LMS
- Email Marketing Platform
- Event Platform
- Survey Tools
- Finance Tools
Built for the Way Associations Report
Custom-built to show what matters most to your association—all in one place, using the tools you already have (or helping you start fresh.)
Track registrations, renewals, donations, or attendance at a glance
Build reports your staff and leadership will actually use
From basic KPIs to deep-dive visualizations—we’ll tailor it to what matters most to your mission
We can work within your tools (Power BI, Tableau, AMS platforms) or help you get started
Dashboards That Match Your Brand and Your Workflow
We design dashboards that not only deliver insights, but feel like a natural extension of your brand, your team, and how you work.


Don't Just Take Our Word For It
How IntelliData Dashboards Changed the Game
It has changed how we do our business. It puts everyone on the same page. Everyone is looking on the same charts now. We used to look at 50 different charts every morning, it seemed ridiculous, and there was paralysis by analysis.
But now it has gotten to a point where it’s a five-minute process. it’s good to have analytics and get them automated and share them across the organization. We’re now progressively understanding who are donors are, who we are, and what makes us work better and better every day
John Davis
Leadership Institute
Let's Make Reporting Easier
We build dashboards that work with your systems, speak your language, and help your team uncover insights, spot trends, and actually use your data to drive decisions.
Schedule a DemoDashboards & Reporting
We help associations move beyond spreadsheets with dashboards that actually make sense. Whether you’re reporting to your board, tracking member engagement, or analyzing event trends, we’ll design visuals that bring clarity to your data.
Track registrations, renewals, donations, or attendance at a glance
Build reports your staff and leadership will actually use
From basic KPIs to deep-dive visualizations—we’ll tailor it to what matters most to your mission
We can work within your tools (Power BI, Tableau, AMS platforms) or help you get started
No more chasing reports. Just clean, confident data at your fingertips.